
Designing a Data Visualization Online Course with Education Agency Staff
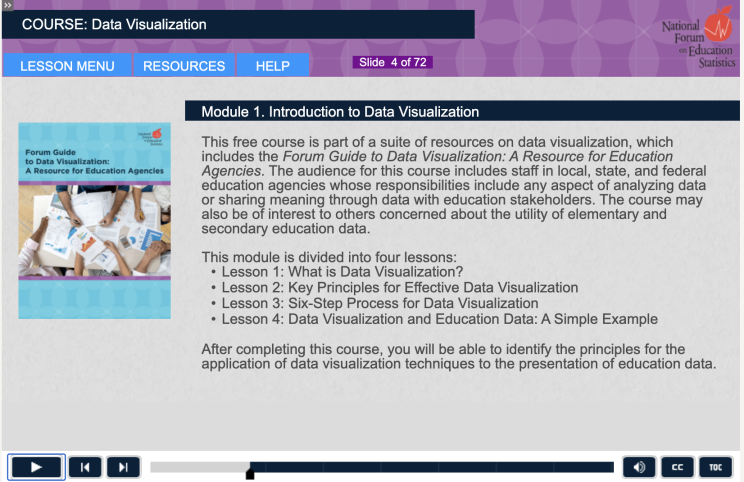 Education agencies collect, analyze, and use data about schools and students to inform practices and improve education. These data are important to a wide range of users who need to be able to understand quickly the meaning behind the data. To effectively share information and to ensure that it can be easily understood, agencies often turn to data visualization, the practice of communicating data meaning in a visual format.
Data visualization transforms data into information through visual presentation and analysis. The process of data visualization is especially useful for education agencies, who must communicate vast amounts of data to many different audiences in ways that are accessible, accurate, and actionable.
The need for education-specific data visualization training
In our work with the National Forum on Education Statistics (Forum), QIP learned from data staff in state and local education agencies (SEAs and LEAs) that the education data community would benefit from training resources specifically designed with an education audience in mind. To meet this need, QIP supported the Forum’s development of two online course modules.
- Module 1: Introduction to Data Visualization introduces the foundational concepts and practices of data visualization.
- Module 2: Applied Data Visualization demonstrates the effective application of data visualization to common education topics.
These online course modules draw on examples provided by education data practitioners and reference the types of data that are commonly used and shared among SEAs and LEAs. They address common challenges faced by education agencies and provide solutions based on recognized effective practices. QIP designed these tools to train staff in education agencies at all levels. They may also be of interest to researchers, policymakers, community members, and others who use education data.
The benefits of co-design
The initial idea for the course emerged from discussions among federal, state, and local education agency representatives to the Forum, many of whom volunteered to participate in the course design process. These volunteers included technologists, program area specialists, education data analysts, and others who are responsible for communicating data in their agencies. Working with National Center for Education Statistics (NCES) and Forum leaders, QIP engaged the volunteers in each step of the development process, from determining the focus and objectives of each module through recommending content and designing visuals. Through a series of initial meetings, QIP used participant feedback to develop draft outlines, storyboards, and scripts. These materials were shared with the participants, who provided written feedback that QIP used to improve each draft. QIP also met with the full group to address questions, resolve disagreements, and build consensus around each element of the course. Participants were encouraged to describe data visualization challenges and successes in their agencies, and QIP used these discussions to design course activities, visualizations, and quizzes. This co-design process resulted in graphics and examples that are familiar to data staff in education agencies and that represent the types of data and visualizations they commonly use. After extensive review and feedback, QIP programmed the course using Adobe Captivate software and developed a custom assessment and certificate of completion.
Forum representatives who were not part of the course development team served as reviewers. They also shared the draft content, visualizations, and design elements that QIP developed with their colleagues for feedback. This helped the development team to confirm that the content, tone, and visuals of the course were appropriate for many different education agencies across the country. The result of this co-design process is a course that has been used by many different SEAs and LEAs. Forum members reported that these courses have also reduced the burden on each agency of finding and developing courses independently.