

This blog post is part of QIP’s Learning series. Check back each week for a new post exploring approaches, strategies, and lessons learned from QIP’s work in training, coaching, and course development. Stay up to date on QIP’s latest learning resources, courses, and insights! Email info@qi-partners.com to join our newsletter and receive a FREE data visualization poster and discussion cards.
Creating a Digital Resource for Guided Coaching
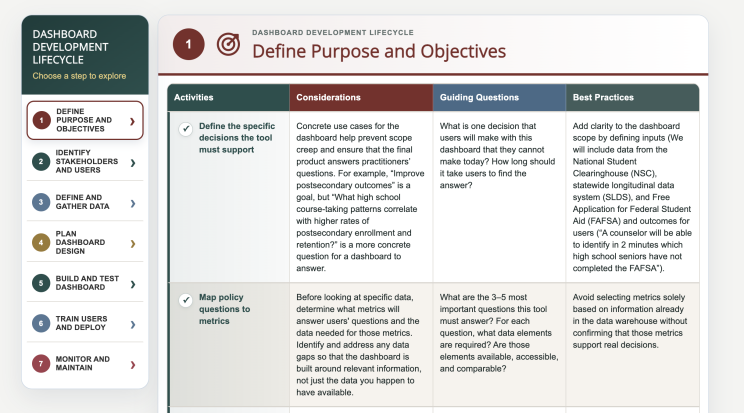
As part of its work on the K12 Community of Practice: Using Postsecondary Data, QIP identified the need for a resource to support the development of data dashboards and created the Dashboard Development Life Cycle graphic.
By designing the online resource around learners' varying levels of expertise—and around the conversations the resource could generate—QIP in collaboration with AEM created a tool that bridges independent exploration and guided coaching. The result is an interactive learning experience that makes a complex process more approachable while supporting deeper dialogues, increased awareness, and more individualized learning.
The Action Fund
The Action Fund is a grant program for government or non-profit agencies that handle state-level postsecondary outcome data. The purpose of the Action Fund is to expand the use of postsecondary outcomes data to better prepare students for the transition to higher education and the workforce. QIP provides technical assistance and coaching to Action Fund participants as they work on their projects.
Many Action Fund participants are developing data dashboards as part of their projects. Dashboard development is a complex process that requires careful consideration of project management, stakeholder engagement, data, governance, training, technology, accessibility, and visual design. Participants bring varying levels of experience to each of these areas. Someone who is comfortable working with data, for example, may be less familiar with stakeholder engagement or user-centered design.
Encouraging Coaching
Coaching is important because it helps ensure project success. Experienced guides help fill gaps in knowledge; they can provide resources and solutions that project participants may not have previously considered. A good coaching relationship, however, relies on communication from both parties to determine what information is needed and when.
Because data dashboards span so many knowledge areas, QIP coaches recognized that participants might not seek coaching when unfamiliarity prevented them from identifying gaps in their own knowledge or recognizing when additional guidance was needed. Without understanding the entire process, participants could leave critical areas unaddressed.
To help participants have a more rounded understanding of their projects and encourage further questions from participants, QIP created a resource that would provide high-level practical guidance on each step of the development or enhancement of a data dashboard. The infographic needed to go beyond technical requirements to highlight key activities, considerations, guiding questions, and best practices to help participants navigate through the process.
Rather than attempting to teach every aspect of dashboard development in a single resource, QIP designed the Dashboard Development Life Cycle as a scaffold intended to help Action Fund participants identify areas of need and encourage participants to seek coaching. Guided questions, considerations, and best practices are intentionally designed to prompt further exploration rather than provide every answer. Participants can use the resource to reflect on their own projects, and in turn identify areas where they need more assistance. In this way, the resource helps make Action Fund coaching more targeted and responsive to each project team's needs.
Making Complex Information Approachable
Because the stages of building a data dashboard can be complex and highly technical, QIP wanted to ensure that this information would be both helpful to users who had a strong knowledge base in an area, but still accessible for those less familiar. The development lifecycle was broken out into steps, then further broken down into activities, considerations, guided questions, and best practices.
The visual and interactive design supports this approach. Large headers, clearly defined sections, and a chart-like structure help users quickly understand where they are within the development life cycle and navigate to the information they need. Rather than requiring every participant to move through the resource in the same way, the format supports exploration based on an individual team's needs, experience, and stage of development.
The Dashboard Development Life Cycle gives Action Fund participants a shared framework for understanding a complicated process while helping them identify what they already know, what they may have overlooked, and where they need additional guidance.
Supporting Different Needs
The Dashboard Development Life Cycle interactive graphic is an example of how an digital tool can be designed to meet the needs of agencies that are at different levels of dashboard development and provide actionable next steps. The QIP team uses the tool to inform coaching, but it is designed to be useful to any agency interested in developing or improving a dashboard. The Dashboard Development Life Cycle is available for public use at https://k12usingpsdata.com/dashboard-development-life-cycle/.


